Mechanical Testing
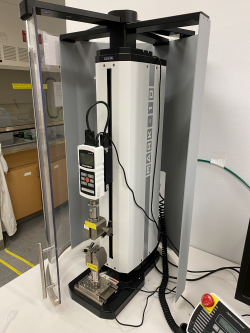
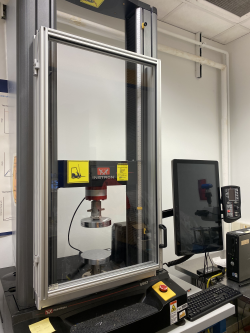
| Mark-10 ESM303 [SOP] | Instron 5967 [SOP] | |
|---|---|---|
| Load Cells: | 500 mN, 25 N, 500 N, 1500 N | 30 kN |
| Load Capacity: | 1.5 kN @ up to 610 mm/min | 30 kN |
| Speed range: | 13 - 330 mm/min | 0.001 mm/min - 1000 mm/min |
| Travel range: | 45.7 cm | 1.212 m |
| Max width: | n/a | 0.418 m |
The Mark-10 ESM303 Mechanical Tester is a mechanical testing frame capable of testing materials under tensile, cyclic, compressive, and 3-point bending modes. This machine has several load cells: a 1500 N, a 500 N, a 25 N, and a 500 mN load cell.
The Instron Mechanical Tester is a mechanical testing frame capable of testing materials under tensile, compressive, and 3-point-bending modes. This machine is equipped with a 30kN load cell.
Loading
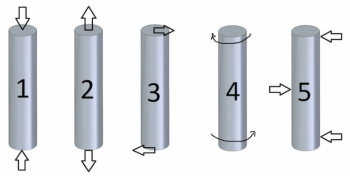
A material in service is subjected to different forces. Depending on the magnitude of these forces, the metal may or may not change its shape. The act of applying the force is known as loading. There are several different ways in which these forces may be applied on a part, including compression, tension, and bending. [1] [2]
Stress and Strain
Stress is defined as the ratio of applied force to the cross-sectional area of the material it is applied to. The formula for calculating (true) material stress is:
[math]\displaystyle{ \sigma_t =\frac{F}{A}, }[/math]
Where F is force, A is area, and [math]\displaystyle{ \sigma }[/math] is stress. Stress can be understood as an internal force induced in the material in response to an externally applied force (Newton’s 3rd law). It will try to resist any change in dimension caused by the external force. Strain is defined as the ratio of the change in dimension to the initial dimension of the metal. It does not have a unit (sometimes designated as length/length). The formula for calculating (true) strain is:
[math]\displaystyle{ \epsilon_t = \int_{l_0} ^l \frac{dl}{l} = ln(\frac{l}{l_0}), }[/math]
Where [math]\displaystyle{ l_0 }[/math] is starting or initial length, l is current length, and [math]\displaystyle{ \epsilon }[/math] is strain. In many applications, a simpler form of strain, commonly called engineering or nominal strain, is used. This type of strain is defined as
[math]\displaystyle{ \epsilon_e = \frac{(l-l_0)}{l_0} }[/math]
When the strains are reasonably small, the engineering and true strains are approximately the same. The elastic deformation in metals and ceramics rarely exceeds 0.005, and for this value, the difference between [math]\displaystyle{ \epsilon_t }[/math] and [math]\displaystyle{ \epsilon_e }[/math] can be neglected. In a likewise fashion, engineering (nominal) stress is defined as:
[math]\displaystyle{ \sigma_e = \frac{F}{A_0} }[/math]
where [math]\displaystyle{ A_0 }[/math] is the original area of cross-section. Normal strain may be positive or negative depending on the external force’s directions and therefore effect on the original length. Tensile stresses and strains are considered to be positive while their compressive counterparts are considered to be negatives. While there are multiple types of stresses and strains, this article focuses on their normal longitudinal variants.
Tensile Testing & Engineering Stress-Strain Curves
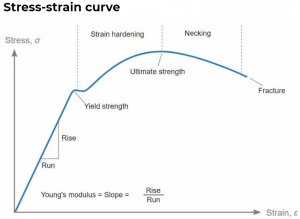
The most common method to obtain a stress-strain curve is to subject a sample to a tensile test. When setup for tensile testing, the mechanical testers have two claws which hold the two extremes of the sample and pull it at a uniform rate. The force applied and the strain produced is recorded until a fracture occurs. The two parameters are then plotted on an X-Y graph to get a stress-strain curve. Note that the testers produces a force-travel plot (with the same general shape) that must be manually converted to a stress-strain curve using the aforementioned equations in conjunction with the sample dimensions (or entering the sample dimensions into the software on the Instron). There are various sections on the stress and strain curve (described below) that describe different behavior of a material depending on the amount of stress induced. Stress and strain curves for brittle and ductile materials are different.
Elastic & Plastic Deformation
In the early (low strain) portion of the curve, most materials obey Hooke’s Law [math]\displaystyle{ (F_s=kx) }[/math] to a reasonable approximation, with the constant of proportionality being the modulus of elasticity or Young’s modulus (E), described by the following equation:
[math]\displaystyle{ \sigma_e = E\epsilon_e \rightarrow E= \frac{\sigma_e}{\epsilon_e} }[/math]
Also known as the modulus of resilience, it is analogous to the stiffness of a spring (k). That’s also why Hooke’s Law includes a spring constant. Materials exhibit elastic flow (ability to return to their original shape upon unloading) up to a certain strain.
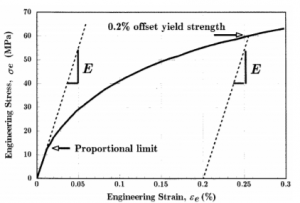
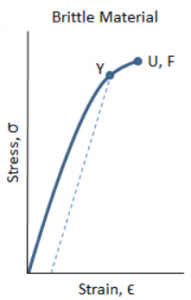
As strain is increased, many materials eventually deviate from the linear proportionality of Hooke’s Law, the point of departure being termed the proportional limit. This is usually associated with stress-induced “plastic” flow in the specimen. Here the material is undergoing a rearrangement of its internal molecular or microscopic structure, in which atoms are being moved to new equilibrium positions. This plasticity requires a mechanism for molecular mobility, which in crystalline materials can arise from dislocation motion. Materials lacking this mobility, for instance by having internal microstructures that block dislocation motion, are usually brittle rather than ductile (fail at lower rather than higher strains). The stress-strain curve for brittle materials are typically linear over their full range of strain, eventually terminating in fracture with no to minimal plastic flow (permanent deformation).
Yield Stress
The stress needed to increase the strain beyond the proportional limit in a ductile material continues to rise beyond the proportional limit; the material requires an ever-increasing stress to continue straining, a mechanism termed strain hardening. Microstructural rearrangements associated with plastic flow are usually not reversed. The residual strain induced by a given stress can be determined by drawing an unloading line from the highest point reached on the engineering stress strain curve at that stress back to the strain axis, drawn with a slope equal to that of the initial elastic loading line. This is done because the material unloads elastically, there being no force driving the molecular structure back to its original position. A closely related term is the yield stress [math]\displaystyle{ (\sigma_y) }[/math]; this is the stress needed to induce plastic deformation in the specimen. Since it is often difficult to pinpoint the exact stress at which plastic deformation begins, the yield stress is often taken to be the stress needed to induce a specified amount of permanent strain, typically 0.2%. The construction used to find this “offset yield stress” is shown below, where a line of slope E is drawn from the strain axis at [math]\displaystyle{ \epsilon = 0.2\% }[/math]; this is the unloading line that would result in the specified permanent strain. The stress at the point of intersection with the curve is the offset yield stress. Engineering calculations typically use a material’s yield strength for determining its ability to resist a load because if the load is greater than the yield strength, the result will be unwanted plastic deformation. See this video for a detailed explanation of how to find the 0.2% offset yield stress & strain in Excel.
Ultimate Strength
It appears that the rate of strain hardening decreases up to the ultimate strength (UTS), the greatest level of stress on the curve. Beyond that point, the material appears to strain soften, so that each increment of additional strain requires a smaller stress. The apparent change from strain hardening to strain softening is an artifact of the plotting procedure (using engineering rather than true values), as is the maximum observed in the curve at the UTS. Even though the UTS is perhaps the materials property most commonly reported in tensile tests, it is not a direct measure of the material due to the influence of geometry, and should be used with caution. The yield stress is usually preferred to the UTS in designing with ductile metals, although the UTS is a valid design criterion for brittle materials that do not exhibit flow-induced reductions in cross-sectional area.
Necking
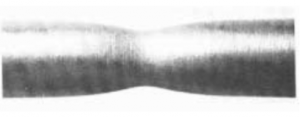
The true stress is not quite uniform throughout the specimen, and there will always be some location - perhaps a nick or some other defect at the surface - where the local stress is maximum. Once the maximum in the engineering curve has been reached, the localized flow at this site cannot be compensated by further strain hardening, so the area there is reduced further. This increases the local stress even more, which accelerates the flow further. This localized and increasing flow soon leads to a “neck” in the gage length of the specimen such as that seen below.
Until the neck forms, the deformation is essentially uniform throughout the specimen, but after necking all subsequent deformation takes place in the neck. The neck becomes smaller and smaller, local true stress increases all the time, until the specimen fails. This will be the failure mode for most ductile metals. As the neck shrinks, the nonuniform geometry there alters the uniaxial stress state to a complex one involving shear components as well as normal stresses.
Drawing
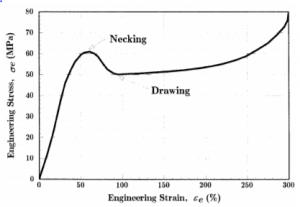
This figure shows the engineering stress-strain curve for a semi-crystalline thermoplastic. The response of this material is similar to that of typical metals, in that it shows a proportional limit followed by a maximum in the curve at which necking takes place. (This is commonly described in plastics as the yield stress, although plastic flow has begun at earlier strains.) The polymer, however, differs dramatically in that the neck does not continue shrinking until the specimen fails. Rather, the material in the neck stretches only to a “natural draw ratio” which is a function of temperature and specimen processing, beyond which the material in the neck stops stretching and new material at the neck shoulders necks down. The neck then propagates until it spans the full gage length of the specimen, a process called drawing. This process can be observed without the need for a testing machine, by stretching a “six-pack holder.” Not all polymers are able to sustain this drawing process. Drawing occurs when the necking process produces a strengthened microstructure whose breaking load is greater than that needed to induce necking in the untransformed material just outside the neck.
Failure
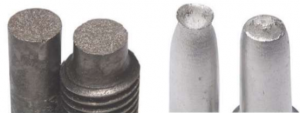
Ductile specimens often fail with a “cup and cone” geometry as seen below, in which the outer regions fail in shear and the interior in tension. When the specimen fractures, the engineering strain at break [math]\displaystyle{ (\epsilon_f) }[/math] will include the deformation in the necked region and the un-necked region together. Since the true strain in the neck is larger than that in the un-necked material, the value of [math]\displaystyle{ (\epsilon_f) }[/math] will depend on the fraction of the gage length that has necked. Therefore, [math]\displaystyle{ (\epsilon_f) }[/math] is a function of the specimen geometry as well as the material, and thus is only a crude measure of material ductility. Brittle specimen failure is characterized by very rapid cracking under stress while little or no evidence of ductility or plastic degradation before the fracture occurs. When a piece of equipment suffers a brittle fracture, there is no thinning or necking down. Rather, this damage mechanism often causes cracking without warning, sometimes fracturing equipment into many pieces. Brittle fracture is often caused by low temperatures. If a metal is at or below its brittle-to-ductile transition temperature, then it will be susceptible to brittle fracture. Critical sized flaws, metallurgical degradation, large grain sizes, and high thickness significantly increase the likelihood of a sample experiencing brittle fracture.
True Stress-Strain Curve
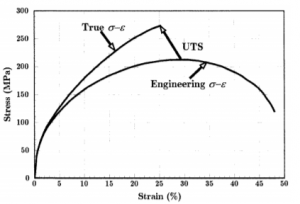
During elastic deformation, the change in cross-sectional area is less than 1% for most metals and ceramics; thus [math]\displaystyle{ \sigma_e ∼= \sigma_t }[/math]. However, during plastic deformation, the differences between the true and the engineering values become progressively larger as the specimen dimensions experience substantial change from their original values. Due to this, the engineering stress-strain curve must be interpreted with caution beyond the elastic limits. Using the true stress [math]\displaystyle{ \sigma_t = \frac{F}{A} }[/math] rather than the engineering stress [math]\displaystyle{ \sigma_e = \frac{F}{A_0} }[/math] can give a more direct measure of the material’s response in the plastic flow range, although this requires using the following additional equations:
[math]\displaystyle{ \epsilon_t =ln(1+\epsilon_e) }[/math] [math]\displaystyle{ \sigma_t = \sigma_e(1+\epsilon_e) }[/math]
Ductile metals often have true stress-strain relations that can be described by a simple power-law relation of the form:
[math]\displaystyle{ \sigma_t = A\epsilon_tn → log(\sigma_t) = log(A) + nlog(\epsilon_t) }[/math]
The strain hardening parameter (n), is the slope of the log-log plot, and is useful as a measure of the resistance to necking. Ductile metals at room temperature usually exhibit values of n from 0.02 to 0.5.
Strain Energy, Resilience, & Toughness
The area under the engineering stress-strain curve up to a given value of strain is the total mechanical energy per unit volume consumed by the material in straining it to that value. This is easily shown as follows:
[math]\displaystyle{ U^* = \frac {1}{V} \int FdL= \int_0^L \frac{FdL}{A_0L_0}= \int_0^{\epsilon}\sigma d\epsilon }[/math]
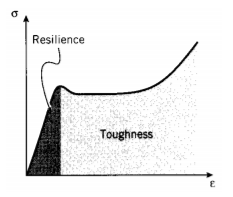
In the absence of molecular slip and other mechanisms for energy dissipation, this mechanical energy is stored reversibly within the material as strain energy. The area up to the yield point is termed the modulus of resilience, and the total area up to fracture is termed the modulus of toughness.
The term “resilience” alludes to the concept that up to the point of yielding, the material is unaffected by the applied stress and upon unloading will return to its original shape. But when the strain exceeds the yield point, the material is deformed irreversibly, so that some residual strain will persist even after unloading. The modulus of resilience is then the quantity of energy the material can absorb without suffering damage. Similarly, the modulus of toughness is the energy needed to completely fracture the material. Materials showing good impact resistance, as well as ductile materials, are generally those with high moduli of toughness. The resilience & toughness integrals can be calculated from stress-strain data via methods such as trapezoidal Riemann sums in Excel.
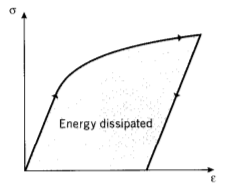
During loading, the area under the stress-strain curve is the strain energy per unit volume absorbed by the material. Conversely, the area under the unloading curve is the energy released by the material. In the elastic range, these areas are equal and no net energy is absorbed. But if the material is loaded into the plastic range as shown above, the energy absorbed exceeds the energy released and the difference is dissipated as heat.
Compression
Materials that exhibit high tensile strength tend to (but do not always!) exhibit low compressive strength. Likewise, materials high in compressive strength tend to exhibit low tensile strength. Therefore, compression testing is often used on brittle materials such as concrete, metals, plastics, ceramics, composites, and corrugated materials like cardboard. These materials are often used in a load-bearing capacity where their integrity under compressive forces is critical.
Unlike tensile tests, which are usually conducted to determine the tensile properties of a specific material, compression tests are often performed on finished products. Common items such as tennis balls, golf balls, water bottles, protective cases, plastic pipes, and furniture are all examples of products that need to be evaluated for their compressive strength. For example, an engineer may want to conserve plastic by creating water bottles with thinner walls, but the bottles must still be strong enough to be packed in pallets and stacked on top of each other for transport. Compression testing can help the engineer fine tune the balance between product strength and material conservation.
As long as the loads are sufficiently small (stresses less than the proportional limit), in many materials the relations outlined for tensile testing apply equally well in compression. The expression for deformation [math]\displaystyle{ (\delta) }[/math] from a given load
[math]\displaystyle{ \delta = \frac{FL}{AE} }[/math],
applies just as in tension, with negative values for δ and F indicating compression. Further, the modulus E is the same in tension and compression to a good approximation, and the stress-strain curve simply extends as a straight line into the third quadrant as shown below.
There are some practical difficulties in performing stress-strain tests in compression. If excessively large loads are mistakenly applied in a tensile test, perhaps by wrong settings on the testing machine, the specimen simply breaks and the test must be repeated with a new specimen. But in compression, a mistake can easily damage the load cell or other sensitive components, since even after specimen failure the loads are not necessarily relieved. This is why when designing a method for the Instron tester, there must always be a second stop condition at 28kN load. The ultimate compressive strength of a material is the value of compressive stress reached when the material fails completely. When brittle materials reach their ultimate compressive strength they are crushed, and the load drops drastically. Materials with higher ductility, (most plastics) do not rupture, but instead continue deforming until the load is no longer being applied to the specimen, but rather between the two compression platens. In these cases, compressive strength can be reported as specific deformations such as 1%, 5%, or 10% of the test specimen's original height. [6]
Bend Testing
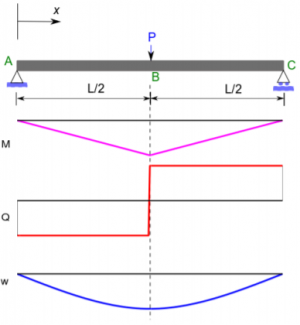
In bending tests, standardized, mostly cylindrical specimens are placed centrally on a test fixture. [8] The rounded support rollers (bearings) are arranged parallel to each other at a certain distance (support width). The diameter of the cylindrical specimen is proportional to the support width of the bearings. The test punch, which moves down slowly and at a constant speed, loads the sample with increasing force until it breaks or reaches the previously determined deformation. Flexural modulus (elastic modulus in bending), stress-strain behavior, and failure limits can all be obtained using a bend test. [9] The 3-point bending test is the most frequently performed bending test. However, it has the disadvantage that in addition to the compressive and tensile forces exerted, transverse forces are also effective in the material.
During the test, the values of the bending force and deflection are recorded, which are then used to determine the material characteristics. The test sequence is plotted in a stress-strain curve and can also be recorded with a video camera. Bending tests are performed to obtain information about the bending behavior of the tested material from the single-axis bending stress. In case of brittle materials, the bending strength is determined this way. For ductile materials, the limit yield point, greatest possible bending angle, and Young’s modulus are determined.
Calculation of the flexural stress [math]\displaystyle{ \sigma_f }[/math]
- [math]\displaystyle{ \sigma_f = \frac{3 F L}{2 b d^2} }[/math] for a rectangular cross section
- [math]\displaystyle{ \sigma_f = \frac{F L}{\pi R^3} }[/math] for a circular cross section[10]
Calculation of the flexural strain [math]\displaystyle{ \epsilon_f }[/math]
- [math]\displaystyle{ \epsilon_f = \frac{6Dd}{L^2} }[/math]
Calculation of flexural modulus [math]\displaystyle{ E_f }[/math][11]
- [math]\displaystyle{ E_f = \frac{L^3 m}{4 b d^3} }[/math]
in these formulas the following parameters are used:
- [math]\displaystyle{ \sigma_f }[/math] = Stress in outer fibers at midpoint, (MPa)
- [math]\displaystyle{ \epsilon_f }[/math] = Strain in the outer surface, (mm/mm)
- [math]\displaystyle{ E_f }[/math] = flexural Modulus of elasticity,(MPa)
- [math]\displaystyle{ F }[/math] = load at a given point on the load deflection curve, (N)
- [math]\displaystyle{ L }[/math] = Support span, (mm)
- [math]\displaystyle{ b }[/math] = Width of test beam, (mm)
- [math]\displaystyle{ d }[/math] = Depth or thickness of tested beam, (mm)
- [math]\displaystyle{ D }[/math] = maximum deflection of the center of the beam, (mm)
- [math]\displaystyle{ m }[/math] = The gradient (i.e., slope) of the initial straight-line portion of the load deflection curve, (N/mm)
- [math]\displaystyle{ R }[/math] = The radius of the beam, (mm)
In a bending test, the bending stress is greatest in the center of the specimen (highest deflection). At this point, the greatest bending moment is always present. From the central pressure point, the bending moment decreases linearly in both directions toward the bearings. The material is subjected to pressure on its inner side and tension on its outer side. In the outer fibers of the specimen, the bending stress (tensile and compressive stress) is greatest and decreases inwards toward the neutral fiber.
If a partially plastically deformed specimen is relieved during the bending test by raising the test punch, only the internal stresses (residual stresses) present in the material and the resulting torque are still effective. This will partially reshape the sample.
Bending Behavior of Ductile Materials
If the bending stress in the sample made of a ductile material is lower than the limit stress of the plastic deformation, the bending stress is exclusively elastic. As the bending stress increases, the yield strength is exceeded first in the peripheral areas of the specimen. These areas then deform plastically (the so-called material flow). The limit yield point is the limit bending stress up to which easily deformable materials can be loaded by bending without permanent deformation in the marginal area.
The moment this kind of deformation occurs can be determined directly from the deflection-force diagram, in a similar manner to how the yield strength is found in a tensile test. With deflection increasing steadily, more and more internal areas of the specimen are involved in the plastic deformation. This is a result of the stress increase. For steels, for example, the limit yield point is between 10 to 20 percent higher than the yield strength due to the linear stress increase. If the yield strength is exceeded in the edge fibers during the bending test, the inner and exclusively elastically stressed fibers impede the flow movement. Bending tests with ductile materials are different from those performed with brittle materials: Tough materials can be subjected to extreme plastic deformation, but they cannot be broken, no matter how strong the applied force is. Therefore, a bending test with a ductile sample is finished when the yield point is exceeded. The bending strength of ductile materials is determined by the point in time at which the plastic deformation occurs.
Bending Behavior of Brittle Materials
Specimens made of brittle materials show a different bending behavior during materials testing. They break without clearly visible material flow behavior. Therefore, the determination of the limit yield point is more complicated for brittle materials. In order to be able to determine the bending strength nevertheless, the maximum bending stress at which the sample breaks is determined. However, the bending strength is a fictitious value that is not identical to the bending stress actually occurring in the material. Another characteristic of bending tests with brittle materials is the fracture deflection. This technical term describes the greatest possible deflection of a specimen shortly before fracture.
The fracture deflection depends on the support width: Larger distances between the bearings allow for greater deflections. In order to check the strength of brittle materials, the bending test is often more suitable than the tensile test, because the materials are subjected to bending stress only. If this sample were to be subjected to a tensile test, it would break prematurely and measurement problems would occur. For certain brittle materials, the tensile test is therefore replaced by the bending test. These materials include thermosetting sheets and molding materials, thermoplastic injection molding compounds, and fiber-reinforced plastics.
Related Theory
References
- ↑ Velling, A. (2021, May 5). Stress-Strain Curve: How to Read the Graph? Fractory. https://fractory.com/stress-strain-curve/.
- ↑ Meyers, M., & Chawla, K. (2016). Hardness. In Mechanical Behavior of Materials (2nd ed., pp. 214–225). chapter, Cambridge University Press.
- ↑ Roylance, D. (2001, August 23). STRESS-STRAIN CURVES.
- ↑ "Mechanical Properties of Materials. MechaniCalc. (n.d.). https://mechanicalc.com/reference/mechanical-properties-of-materials.
- ↑ United States Naval Academy. (n.d.). FRACTURE OF MATERIALS.
- ↑ Instron. (n.d.). What is Compression Testing? https://www.instron.us/en-us/our-company/library/test-types/compression-test.
- ↑ Penn Center for Musculoskeletal Disorders. Three Point and Four Point Bending | Penn Center for Musculoskeletal Disorders | Perelman School of Medicine at the University of Pennsylvania. (n.d.). https://www.med.upenn.edu/pcmd/3pt-4pt-bending.html.
- ↑ Bending test: Suitable for both brittle and ductile materials. (n.d.). https://www.gom.com/en/topics/bend-test.
- ↑ 3-Point Bend Testing. Bruker. (n.d.). https://www.bruker.com/en/products-and-solutions/test-and-measurement/tribometers-and-mechanical-testers/3-point-bend-testing.html.
- ↑ "Chapter 4 Mechanical Properties of Biomaterials". Biomaterials – The intersection of Biology and Material Science. New Jersey, United States: Pearson Prentice Hall. 2008. p. 152.
- ↑ Zweben, C., W. S. Smith, and M. W. Wardle (1979), "Test methods for fiber tensile strength, composite flexural modulus, and properties of fabric-reinforced laminates", Composite Materials: Testing and Design (Fifth Conference), ASTM International
