X-ray Diffraction
| ARL Equinox 100 XRD [SOP] |
|---|
| [math]\displaystyle{ 2\theta }[/math] Range: 0[math]\displaystyle{ ^\circ }[/math] to 110[math]\displaystyle{ ^{\circ} }[/math] |
| Source: Cu Kα, λ = 1.5406Å |
| Sample Type: Powders |
X-ray diffractometry (XRD) detects crystalline phases in a sample by measuring the diffraction pattern of X-rays at varying angles. X-rays are used because the interplanar spacing for the vast majority of crystalline materials falls in the range of X-ray wavelengths (0.01-10 nm). The MILL’s XRD is set up for powder X-ray diffraction: for the best results, samples should be ground into a fine powder so that the collective group of crystals has a random orientation.
Operation
Anyone who wishes to use or be trained on the XRD must undergo the general lab safety training AND the Georgia Tech Office of Radiological Safety (ORS) X-Ray Safety Training before reporting to the XRD Technical Officer.
Theory
XRDs use an X-ray source to generate a beam of X-rays that are reflected off crystalline planes in the sample material. A detector, which typically rotates around the sample, captures a set of reflected X-rays corresponding to different planar orientations. When each plane of atoms reflects the incident beam, the reflected wave has a specific sinusoidal offset, or phase shift. The reflected X-rays from all planes form a diffraction pattern.
At certain angles, planes may reflect waves with phase shifts separated by the wavelength of the incident X-ray. These reflected X-rays align and recombine into a more intense X-ray, a phenomenon known as constructive interference. Otherwise, the electromagnetic waves instead cancel each other out, undergoing destructive interference. We can measure the diffraction intensity at each angle to determine the orientation of crystals in the sample. Because crystalline materials typically contain equally separated planes, we can also use the intensity data to calculate the separation between two planes of atoms. This allows us to calculate the lattice parameter, [math]\displaystyle{ a }[/math], for virtually any crystalline structure.
Bragg's Law
Given a constant interplanar spacing [math]\displaystyle{ d }[/math], angle of reflection [math]\displaystyle{ \theta }[/math], X-ray wavelength [math]\displaystyle{ \lambda }[/math], and any positive integer [math]\displaystyle{ n }[/math], we can express Bragg's Law, the fundamental equation of diffraction. As seen in Figure 3, the sine of the angle of reflection represents the number of wavelengths in the corresponding phase shift over the interplanar atomic spacing. [math]\displaystyle{ \sin(\theta) = (\frac{n\lambda}{2d}) }[/math]
Or more commonly: [math]\displaystyle{ 2d\sin(\theta) = n\lambda }[/math]
For a family of planes corresponding to the Miller indices [math]\displaystyle{ \{h,k,l\} }[/math], denote the normal vector to that plane as:
[math]\displaystyle{ {\bf\vec{N}} = \langle h, k, l \rangle }[/math]
[math]\displaystyle{ \Vert{\bf\vec{N}}\Vert = \sqrt{h^2 + k^2 + l^2} }[/math]
Note that in a cubic crystal:
[math]\displaystyle{ d = \frac{a}{\Vert{\bf\vec{N}}\Vert} }[/math]
For a given crystal, [math]\displaystyle{ \frac{\lambda}{2a} }[/math] is constant. Therefore:
[math]\displaystyle{ \sin(\theta) = \Vert{\bf\vec{N}}\Vert(\frac{\lambda}{2a}) }[/math]
[math]\displaystyle{ \frac{\sin(\theta_1)}{\sin(\theta_2)} = \frac{\Vert{\bf\vec{N_1}}\Vert}{\Vert{\bf\vec{N_2}}\Vert} }[/math]
This relation between reflection angle and the Miller indices allows us to determine crystal structures from an XRD plot.
Data
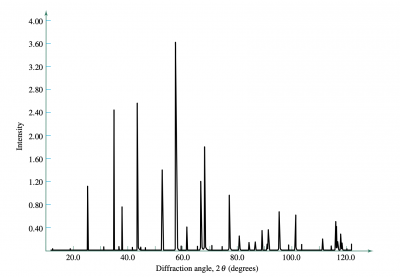
If the angle of reflection is theta, the angle between the incident and reflected waves is [math]\displaystyle{ 2\theta }[/math]. In the plot, we represent the range of angles as [math]\displaystyle{ 2\theta }[/math], on the x-axis, while detection intensity is measured on the y-axis.
For a specific family of planes, there are distinct diffraction patterns—there are two important rules which allow us to use peak data to determine if a material is BCC or FCC. For BCC structures, the sum of the Miller indices, [math]\displaystyle{ h + k + l }[/math], must be even for diffraction to occur on the [math]\displaystyle{ \{h,k,l\} }[/math] family of planes. For the FCC structure, [math]\displaystyle{ \{h,k,l\} }[/math] must all have the same parity (all even or all odd).


