UV-Vis Spectroscopy: Difference between revisions
No edit summary |
No edit summary |
||
| Line 18: | Line 18: | ||
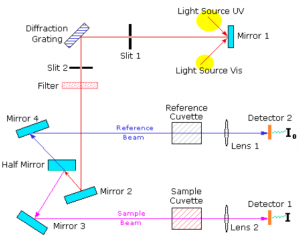
[[File:UVVisDiagram.PNG|thumb|A diagram of the components of a typical UV-Vis spectrometer.]] | [[File:UVVisDiagram.PNG|thumb|A diagram of the components of a typical UV-Vis spectrometer.]] | ||
A beam of light from a visible and/or UV light source (colored red) is separated into its component wavelengths by a prism or diffraction grating. Each monochromatic (single wavelength) beam in turn is split into two equal intensity beams by a half-mirrored device. One beam, the sample beam (colored magenta), passes through a small transparent container (cuvette) containing a solution of the compound being studied in a transparent solvent. The other beam, the reference (colored blue), passes through an identical cuvette containing only the solvent. The intensities of these light beams are then measured by electronic detectors and compared. The intensity of the reference beam, which should have suffered little or no light absorption, is defined as I0. The intensity of the sample beam is defined as I. Over a short period of time, the spectrometer automatically scans all the component wavelengths in the manner described. The ultraviolet (UV) region scanned is normally from 200 to 400 nm, and the visible portion is from 400 to 800 nm. | A beam of light from a visible and/or UV light source (colored red) is separated into its component wavelengths by a prism or diffraction grating. Each monochromatic (single wavelength) beam in turn is split into two equal intensity beams by a half-mirrored device. One beam, the sample beam (colored magenta), passes through a small transparent container (cuvette) containing a solution of the compound being studied in a transparent solvent. The other beam, the reference (colored blue), passes through an identical cuvette containing only the solvent. The intensities of these light beams are then measured by electronic detectors and compared. The intensity of the reference beam, which should have suffered little or no light absorption, is defined as I0. The intensity of the sample beam is defined as I. Over a short period of time, the spectrometer automatically scans all the component wavelengths in the manner described. The ultraviolet (UV) region scanned is normally from 200 to 400 nm, and the visible portion is from 400 to 800 nm. | ||
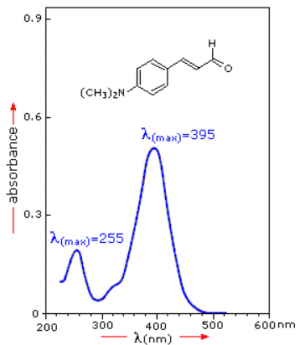
[[File:Typical Plot.PNG|thumb|Typical UV-Vis absorption plot]] | |||
[[Category:Equipment|meas]] | [[Category:Equipment|meas]] | ||
Revision as of 10:20, 17 June 2021
| Avantes AvaSpec-ULS2048CL-EVO |
|---|
| Wavelength range: 200-1100 nm
Resolution: 0.06-20 nm Stray light: 0.19-1.0% Sensitivity: 375,000 (counts/µW/ms integration time) |
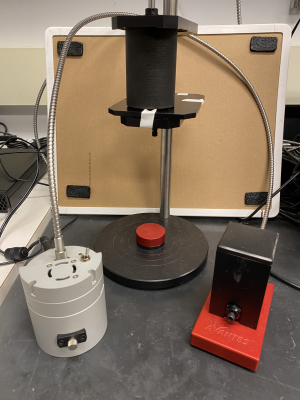
The UV-Vis (ultraviolet-visible) spectrophotometer is a machine that can measure many optical properties of a sample. These properties include transmittance, absorption, and reflectance of light. The spectroscope is able to analyze both solid and liquid specimens. The machine runs through the AvaSoft 8 software.
Principle
A beam of light from a visible and/or UV light source (colored red) is separated into its component wavelengths by a prism or diffraction grating. Each monochromatic (single wavelength) beam in turn is split into two equal intensity beams by a half-mirrored device. One beam, the sample beam (colored magenta), passes through a small transparent container (cuvette) containing a solution of the compound being studied in a transparent solvent. The other beam, the reference (colored blue), passes through an identical cuvette containing only the solvent. The intensities of these light beams are then measured by electronic detectors and compared. The intensity of the reference beam, which should have suffered little or no light absorption, is defined as I0. The intensity of the sample beam is defined as I. Over a short period of time, the spectrometer automatically scans all the component wavelengths in the manner described. The ultraviolet (UV) region scanned is normally from 200 to 400 nm, and the visible portion is from 400 to 800 nm.


